Devtools
Chrome’s network panel shows nothing useful for a WebTransport session: no frames, no
streams. @transport-io/devtools is a panel in the page that shows both, and the drops that
stats() counts, by event.
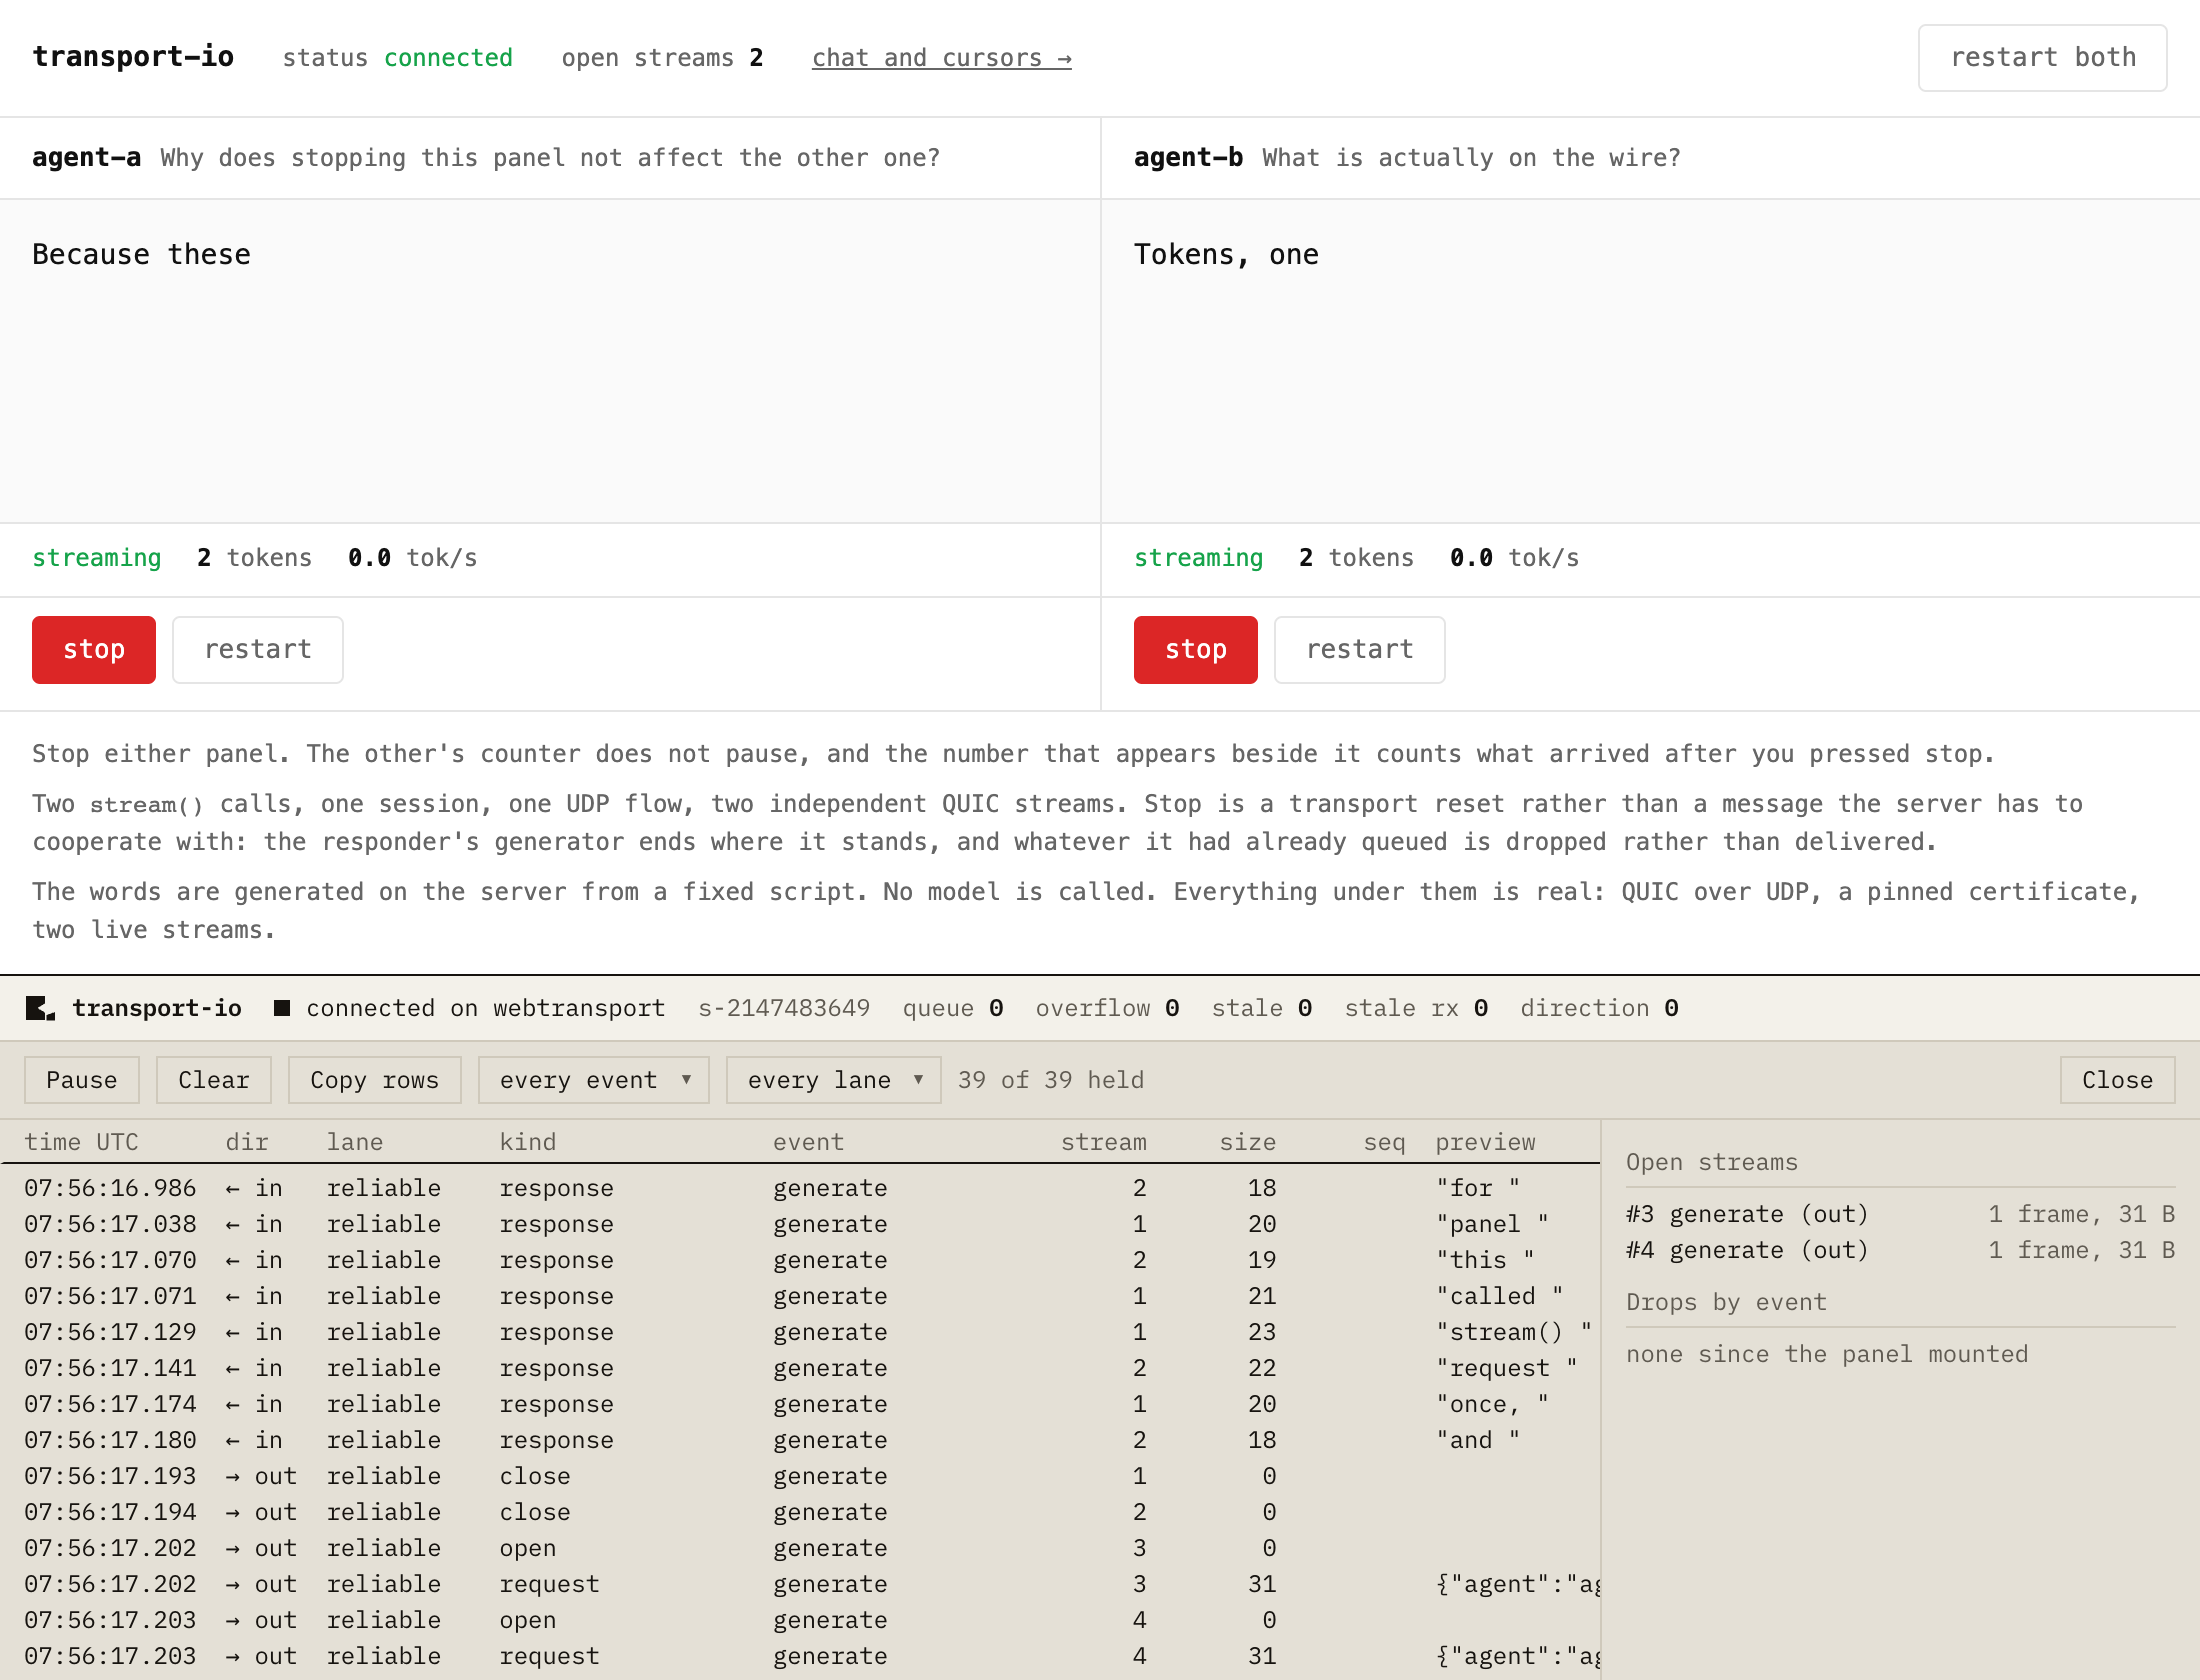
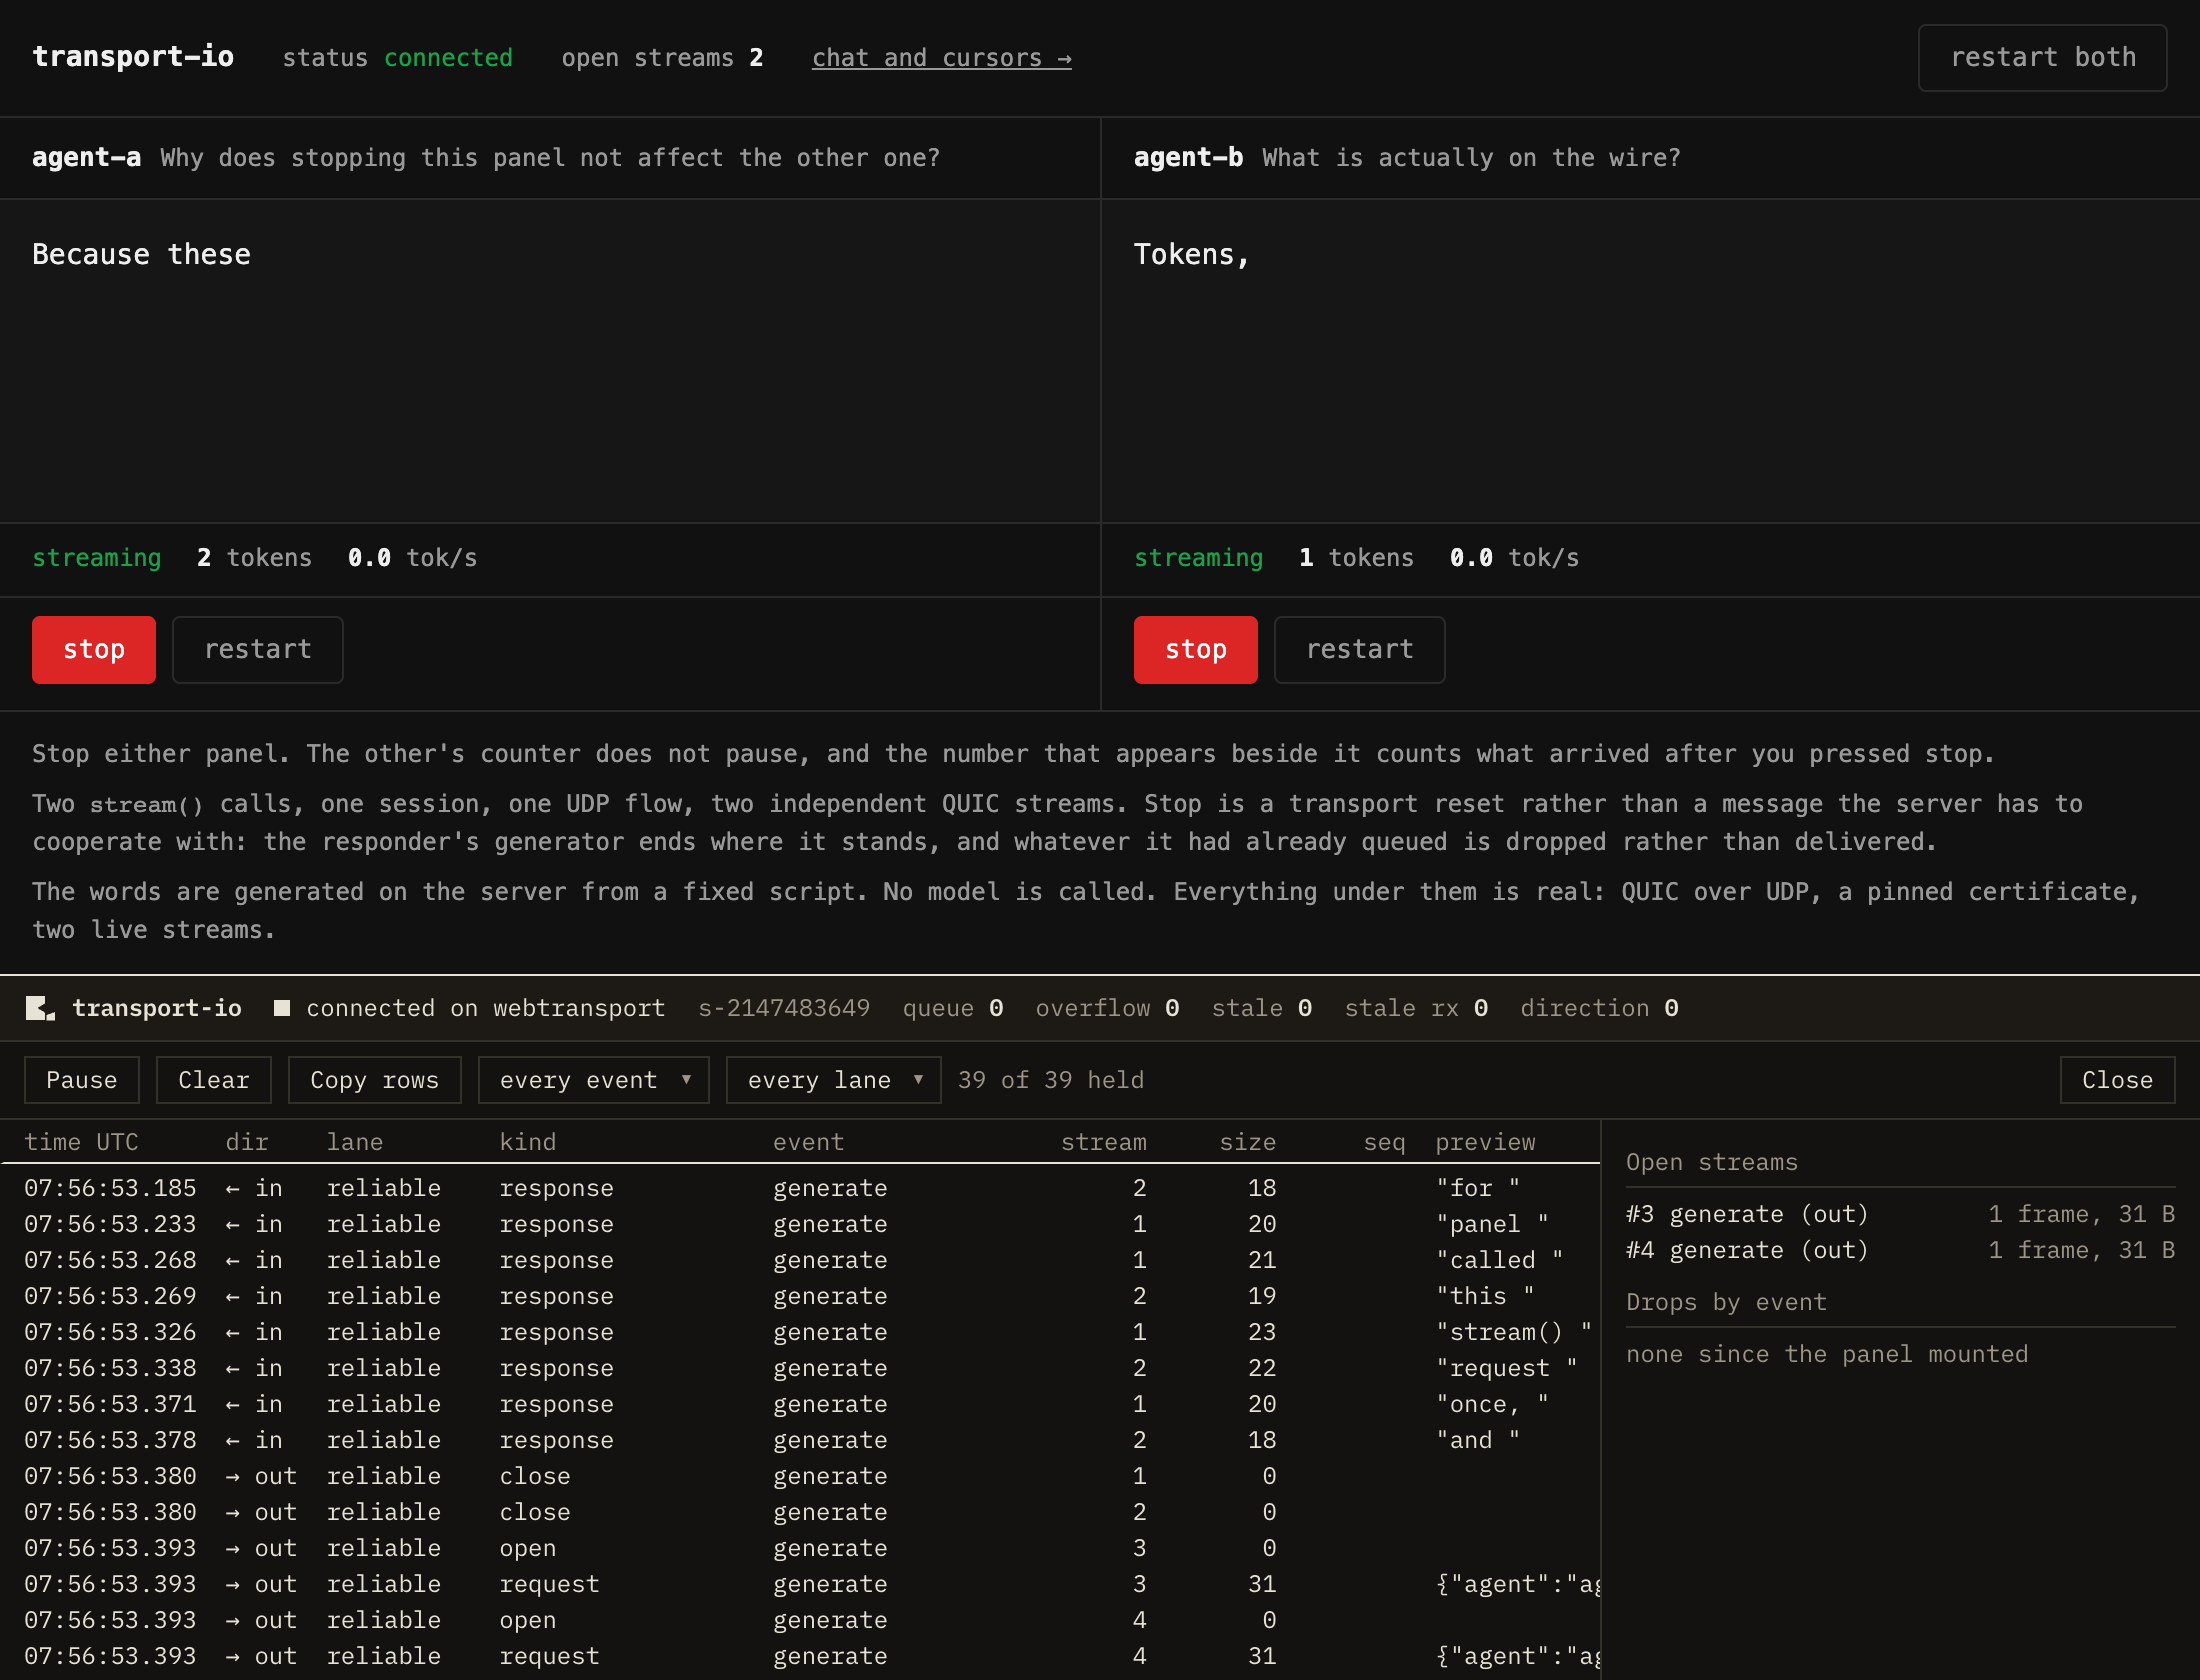
The panel under the chat example’s agents page, over real QUIC: two streams on one session, restarted, so the list has their close rows and the side column the two that replaced them. Every row is a frame that crossed the wire.
npm install @transport-io/devtoolsMount it
Section titled “Mount it”You mount it; nothing loads it for you, in any environment.
import { defineContract, type MapOf, reliable, unreliable } from 'transport-io'
export const contract = defineContract({  chat: reliable<{ from: string; body: string }>(),  cursor: unreliable<{ x: number; y: number }>(),})
export interface AppMap extends MapOf<typeof contract> {}import { mountPanel } from '@transport-io/devtools'import { Client } from 'transport-io'import { connectDev } from 'transport-io/dev-transport'import { type AppMap, contract } from './contract.ts'
export const client = new Client<AppMap>({ contract, connect: () => connectDev() })
// on your own machine onlyif (['localhost', '127.0.0.1'].includes(location.hostname)) mountPanel(client)
await client.connect()mountPanel(client, options?) puts a launcher in the bottom right corner of the page, which
opens the panel, and returns the unmount. It reads no environment, so whether a build gets a
panel is the line you wrote. Mount it before connect() and the handshake is the first thing
it shows. The open panel sits along the bottom of the window and pads the page by its own
height, so a control it would have covered is a scroll away.
That condition keeps the panel off the page in production, and its code is still in the bundle. Import it where the condition is, and it becomes a chunk of its own that only your machine ever requests:
import { Client } from 'transport-io'import { connectDev } from 'transport-io/dev-transport'import { type AppMap, contract } from './contract.ts'
export const client = new Client<AppMap>({ contract, connect: () => connectDev() })
if (['localhost', '127.0.0.1'].includes(location.hostname)) {  const { mountPanel } = await import('@transport-io/devtools')  mountPanel(client)}
In React it is a component, anywhere in the tree:
import { TransportDevtools } from '@transport-io/devtools/react'import type { Client } from 'transport-io'import type { AppMap } from './contract.ts'
export function Tools({ client }: { client: Client<AppMap> }) {  return <TransportDevtools client={client} />}
It renders null unless the build’s process.env.NODE_ENV is development, and a
production bundle contains none of the panel’s code. It takes the client as a prop.
open: true starts it open, preview: true shows the first 256 bytes of each payload,
capacity is how many records it keeps, 1,000 unless given, and visibleRows is how many
the list shows, 200 unless given.
What it costs
Section titled “What it costs”Closed, nothing that can be measured. Open, between 1 and 34 ms of main-thread time a second, 3% of it at worst, with no dropped frame. Measured on the chat example with two clients in a room and both pointers driven at 60, 120 and 280 events a second, in headless Chromium. So leave it mounted, and close it before you profile your own page.
A closed panel still records, so opening it shows what already happened.
The rows
Section titled “The rows”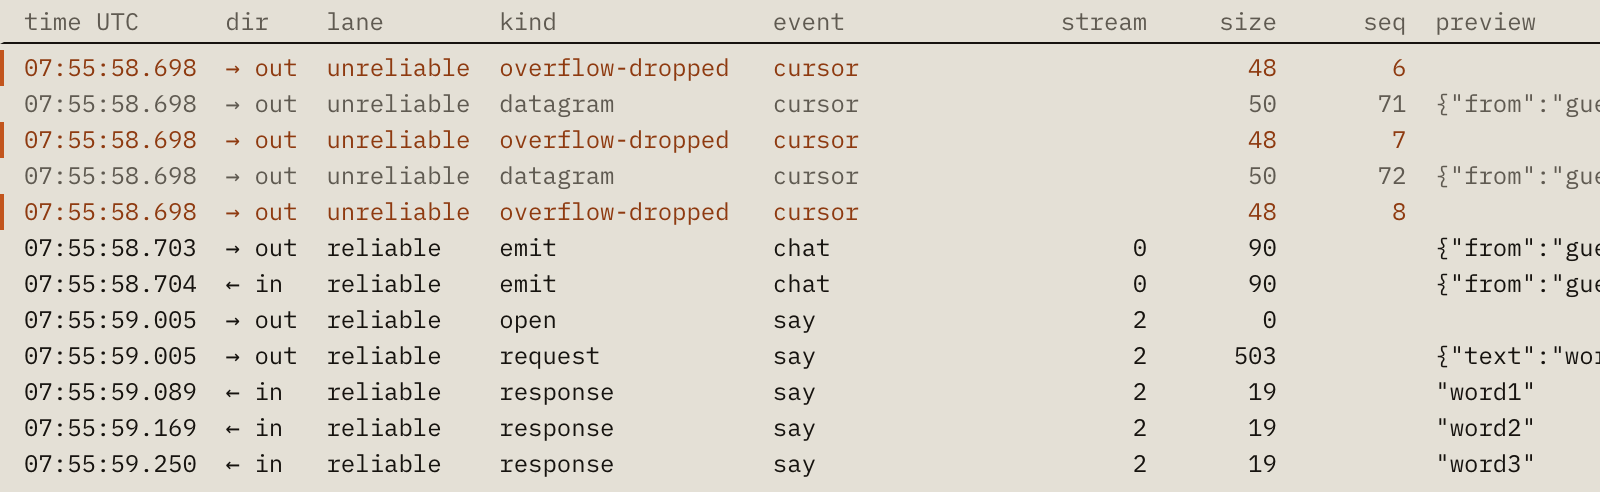
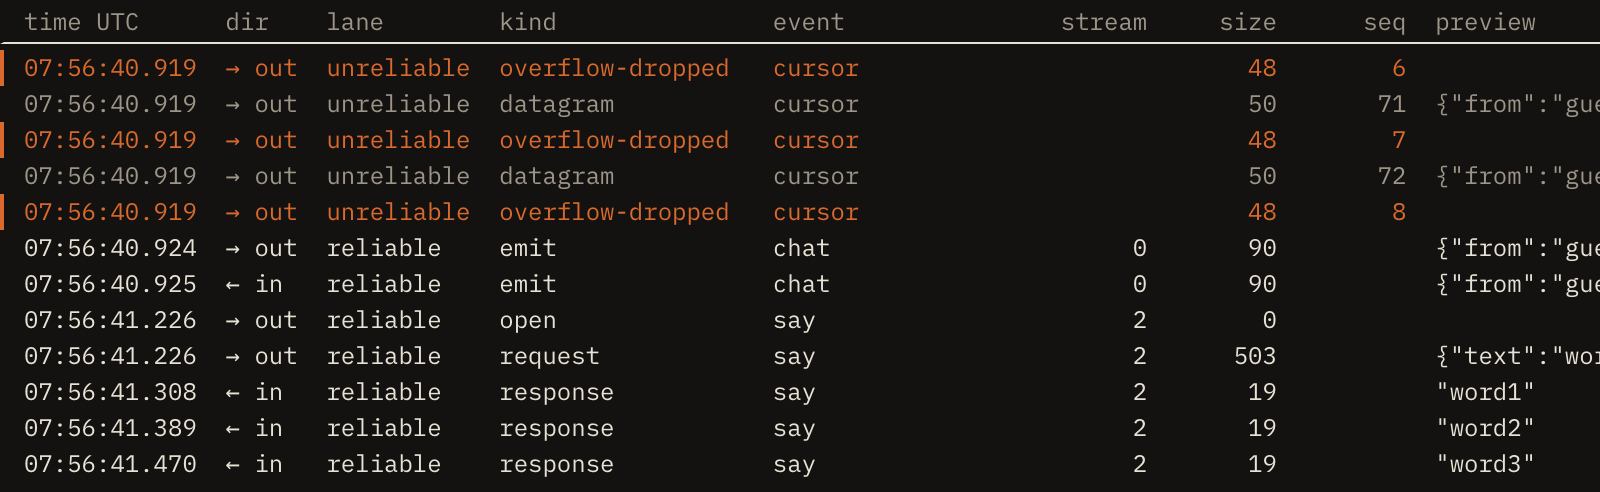
Drops in the accent, datagrams dim, and a stream() from its open
to its responses, all on stream 2.
One row for every frame in and out, newest last. A divider marks each new session, since a reconnect is one. A dim row is on the unreliable lane. A row in the accent colour is a drop.
| Column | |
|---|---|
time UTC | When this client sent it or received it, in UTC, to the millisecond. |
dir | → out is sent by this client, ← in is received. For open and close, which side opened the stream. |
lane | reliable or unreliable, as the contract declares the event. |
kind | What the row is. The next table has each one. |
event | The event’s name. Empty for a frame that carries none, such as a handshake. |
stream | 0 is the emit stream, which carries every emit on the reliable lane. 1 and up is one call() or stream(), numbered as they open. Empty for a datagram, which travels on no stream. On a fallback session everything is 0. |
size | Bytes on the wire, header included. 0 for open and close, which are not frames. |
seq | A datagram’s sequence number. Empty otherwise. |
preview | Empty unless you passed preview: true. Then the first 256 bytes of a JSON payload, or the first 32 bytes of a bytes() payload as hex. |
kind | |
|---|---|
handshake | The first frame each way: protocol version and event table. |
emit | An event on the reliable lane. |
datagram | An event on the unreliable lane. |
open, close | A call() or a stream() starting and ending. Everything between them with the same stream number belongs to it. |
request | The payload of a call() or a stream(). |
response | The answer to a call, or one element of a stream. |
error | The responder failed, and this is what it said. |
credit | A stream’s consumer telling its producer it may send more. See Backpressure. |
join, leave | The server saying it put this client in a room, or took it out. |
| the four drops | The table below. |
The drop counters
Section titled “The drop counters”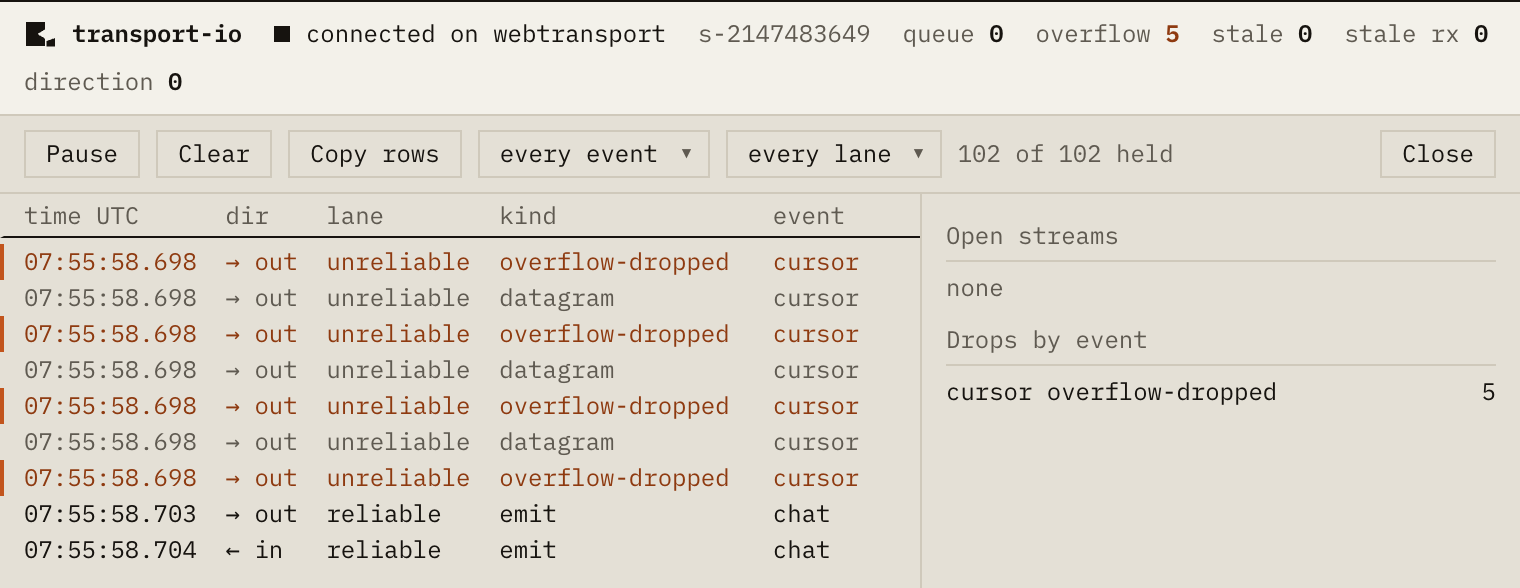
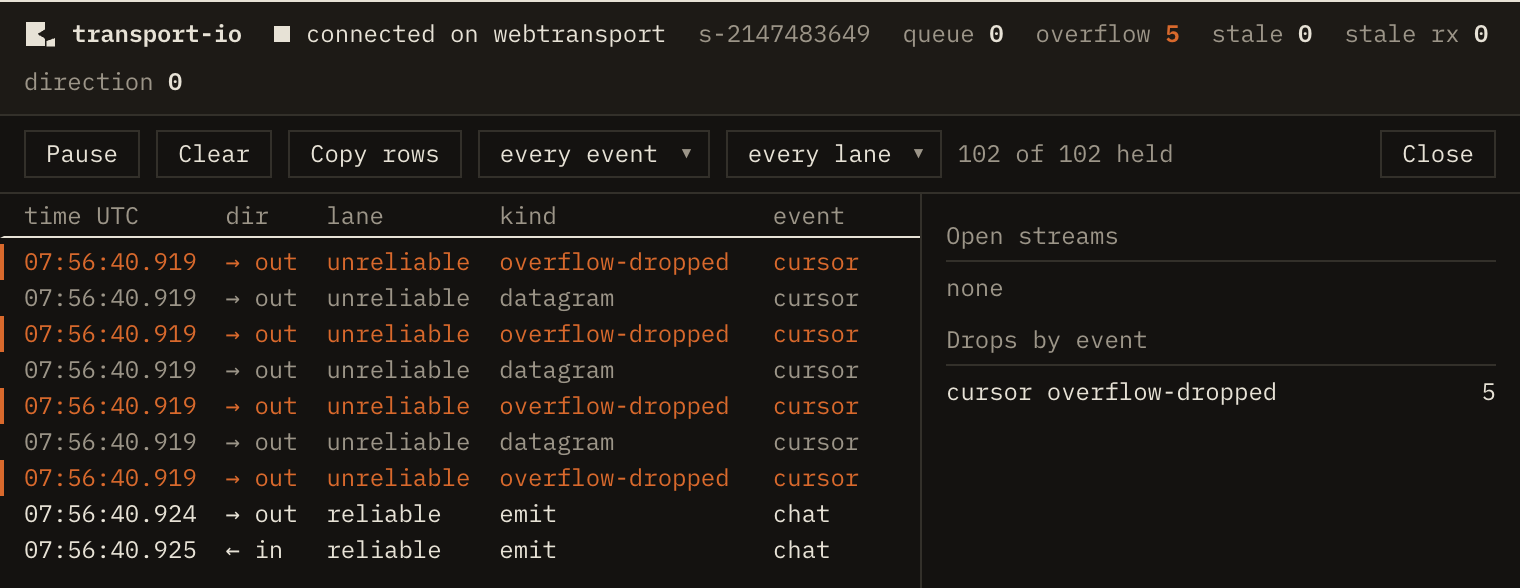
A burst of pointer events outran the datagram queue, so overflow is not zero,
and the list and the side column both say the drops were cursor.
The bar along the top has the counters from client.stats(), for the current session. They
start again with each session. Next to them, Drops by event says which event each drop
was, since the panel mounted. A drop is its own row too, in the accent colour, straight after
the row of the frame it discarded, with the same seq.
| In the bar | stats() | Row kind | What happened |
|---|---|---|---|
queue | queueDepth | Datagrams waiting to be sent right now. Not a drop. | |
overflow | overflowDropped | overflow-dropped | You emitted faster than datagrams leave. The queue holds 64, and the oldest was pushed out to make room. |
stale | staleDropped | stale-dropped | A datagram waited 150 ms in the queue and was discarded unsent, because a late position is worse than none. |
stale rx | staleReceived | stale-received | A datagram arrived that was a duplicate, or older than one already delivered, and was not handed to your handler. |
direction | directionDropped | direction-dropped | The server sent an event the contract says only a client sends. See the two lanes. |
overflow and stale climbing means this client produces datagrams faster than it can send
them: send fewer. stale rx climbing is the network reordering or duplicating, and costs you
nothing.
The rest of the panel
Section titled “The rest of the panel”Open streams: every call and stream in flight, with the frames and bytes that have crossed it.
The connection: status, transport, and why a session is on the fallback.
Pause stops keeping records, so the rows you are reading are not overwritten, and counts what it skipped. Filter by event or by lane. Copy rows puts the visible rows on the clipboard as text, under two lines that say what they were taken from. That text is what to paste into an issue.
Without the panel
Section titled “Without the panel”The panel reads one method, and a logger can read the same one. client.observe() calls you
with a record for every frame, every call stream opening and closing, and every drop:
import type { Client } from 'transport-io'import type { AppMap } from './contract.ts'
export function logDrops(client: Client<AppMap>): () => void {  return client.observe((record) => {    if (record.kind.endsWith('-dropped') || record.kind === 'stale-received') {      console.warn(`${record.kind}: ${record.event} #${record.sequence}`)    }  })}
A client nobody observes builds no records. A record holds no payload; { preview: true }
adds the start of each one as a string, to the subscriber that asked and nobody else. The
fields are in the API reference.
What will bite you
Section titled “What will bite you”These are this client’s drops. The network’s loss is not visible from here, and neither is
what the server dropped on its way to this client, which is peer.stats() on the server.
A gap in the sequence numbers is not loss. The server numbers an event across every room, so a gap can be a broadcast this client was not part of.
The panel records from when it mounts. The counters come from stats() and cover the
whole session either way.
Previews are payloads. preview: true puts the start of each message on screen and in
anything you copy.
An observer runs inside the session, once per frame. Do one cheap thing in it: append to
a bounded list, bump a counter. Never keep JSON.stringify(payload).slice(0, 256) from a
handler as a preview of your own: a sliced string keeps the whole payload alive.